
Raspberry Pi Project Page
LastPi3 GPS Data Logger

I've been looking to build a Pi data GPS logger for some time. And the latest Pi3 Model B, with its quad core processor, at around £30 is the ideal tool.
So how do we go about building a data logger?
We need a computer, an electronic interface to allow us to read analogue voltages, a gps device to provide speed and location, and some software to process the information we'll be collecting.Want to know more? Then read on....
All race car data loggers are GPS based, that is, they get the vehicle's position using GPS satellite data, to record the speed, direction, position, elevation, and the time & date. So we need a means of providing GPS data to the Pi3. Now there are a multitude of GPS capable HAT (Hardware Attached on Top) boards available, and the one I opted for provides not only GPS, but also has GSM/GPRS for mobile communications, battery backup, and has a low power consumption, which is important if we decide to run the Pi from a mobile phone battery. (The Pi3 takes its power from a USB cable connected to a suitable power source)
The next thing to decide is the programming language that we will be using to interface to the hardware. For now, for ease of use, I'll be working with Python. I would like to run Windows IOT on the Pi, and code in Dev Studio, but having looked at the interface, it seems way too complicated for a start, and Python is very versatile, and may execute fast enough to allow me to capture the data at the speed that I want, so we'll start with Python, and see how it goes.
Anyone old enough (like me) to remember playing with Modems to connect to the internet, are probably familiar with AT, or Attention codes. These were the commands that were used to initialise the Modem, select the Baud rate, and the phone number to dial. Well, interestingly, things havent moved on much, and the chipset on the HAT is programmed using AT codes. This is good news for noobies, as it makes setting up the HAT far simpler, as the AT codes are well documented, and it means you dont need to bother with internal programming of the semiconductors. The AT commands effectively provide a nice easy user interface to the chips. eg The AT codes are interpreted by the chips and they do all the complex stuff for you.
My background is microelectronics and computing, and I spent my youth building circuits and writing code in 6809 and Z80 assembler language. My first job when I left college was working for a Scientific Instruments business in Loughborough, called Polymer Laboratories, where I spent several years writing firmware in Z80 assembler, whilst developing a Miniature Materials Tester. We won the Queens Award for Exports, as the business was so successful. So the Raspberry Pi, the electronics, and the code, are right up my street. If you dont have the same depth of experience, dont worry. I'll try not to baffle anyone with terminology, and at the end of this project, I will hopefully have a product that is reliable, and more important, accurate, for less than £150. I shan't be releasing all of the code, after all thats my intellectual property, but I'll certainly post my findings and this will hopefully encourage others to buy a Pi, and have a go themselves.
So lets make a start
Once you have assembled the hardware (Pi3 Model B, microSD card, 2.5A USB power supply, Screen, Keyboard, Mouse and the HAT module), the first step is to build the operating system that the Pi will load when it is powered up. I started off by downloading the Raspbian Stretch image file (2017-11-29-raspbian-stretch.img) from the Raspbian website. Once you have the file, and you have found a 8GB or greater microSD card, you will need to wipe the microSD card, and then use Etcher to write the downloaded and unzipped .IMG image file to the card.Once this is done, the microSD card is plugged in to the Pi3, and the keyboard, mouse, HDMI (Video) and 2.5A USB power supply are attached, power is turned on, and the Raspbian interface appears on the connected HDMI screen. You'll get a tiny orange light on the Pi to signal that the power is present.
For the hardware, I was looking for a GPS HAT module for some time. Then I found the Waveshare GSM/GPRS/GNSS/Bluetooth HAT Expansion Board with Low-Power Consumption Based on SIM868, which not only had GPS, but also supports the latest GLONASS satellite network, that provides more accuracy than GPS alone. Then I read that the HAT also has a SIM card slot, that allows it to send and receive phone calls and text messages. Plus it has Bluetooth (which the Pi3 already has). And it came with the 2 metre long GPS antenna cable, and a few other bits and pieces, so I ordered one from Amazon and a few weeks later this turned up.

The Waveshare HAT device is so versatile that it can be even be programmed from a Windows Desktop PC, via the USB cable, so it doesnt even need to be used with a Pi. In my case, however, that was the intention, so with the Pi powered off, I carefully lined up the header GPIO (General Purpose Input Output) DIL pins, and pushed the HAT board down on to the Pi. The Waveshare HAT gets its power from the GPIO header pins, and passes the serial data directly to the Pi's UART, so there were no other connections to be made to the Pi. Plugging the HAT's GPS header cable in for the external GPS antenna was a bit fiddly, but once done, I plugged in the rest of the antenna to the header cable, and powered the Pi on to see what would happen.
Note: The Pi will need internet access to complete the next task, so setup the Pi3 wifi to connect to your home WiFi, or plug in a LAN cable to provide internet access.
This is where things didnt go quite according to plan. The instructions supplied with the HAT said that I had to turn off the UART for TTY access, and allow the HAT to send its data to the UART. So I manually edited /boot/config.txt and added the line enable_uart=1. After rebooting the Pi, to allow the change to take effect, the next step was to run minicom to establish a terminal session to the HAT. However, Raspbian doesnt come with minicom installed, so you need to run
sudo apt-get install minicomAfter several minutes, the minicom package is fetched, unpacked, and installed in to the Raspbian Pi operating system, and so now you can run minicom.
Open a command shell, and run
pi@raspberrypi:~ $ sudo minicom -D /dev/ttyS0A terminal session will open, and you should now be able to type in an AT command, and the HAT should reply with an OK. But in my case it wouldnt work. All I ended up with was gobbledygook on the screen from the HAT, and eventually it would just lock up. After lots of head scratching, I realised that the text that was appearing on the terminal session was a Login: prompt. This suggested that the Pi was still using the UART to allow a terminal session, which is not what we wanted. After doing some research, I read that the config program must be run to turn off the console session, which I thought should be the cure to the problem.
So I ran
pi@raspberrypi:~ $ sudo raspi-configand Select option 5, Interfacing options, then option P6, Serial, and select No. Then turn off login shell over serial, so that the serial login shell was disabled, and the serial interface is enabled.
After a reboot, I then once again ran
pi@raspberrypi:~ $ sudo minicom -D /dev/ttyS0and this time, when I typed AT and pressed Return, it was responded to with an OK, and I could then start to send codes to the HAT to switch on the GPS module and see what kind of data I could get back.
 AT
 OK
Now to switch the GPS electronics on
 AT+CGNSPWR=1
 OK
After getting familiar with the AT codes used to program the SIM868 GPS chip on the HAT, I realised that it would only update the GPS data at their advertised rate of 1Hz (once a second). Hmm, that wasnt what I expected. I wondered if there might be a way to force the SIM868 to provide updates at a higher rate, when I noticed that the Waveshare documentation included a section where you could send PMTK codes directly to the chip.
Hmm, PMTK, that was worth a google. I then discovered that PMTK was the protocol used to configure a specific manufacturer's chip, but surely as the documentation mentioned it, the SIM868 must support it? So I found a web page that described how to change the update frequency, and sure enough, when I sent the PMTK code to the SIM868, it started updating at 5Hz. Success.
 AT+CGNSCMD=0,"$PMTK220,200*2C"
 OK
The next thing was to see if we could push the chip any further. Would it support 10Hz? So I sent it the PMTK command to update 10 times a second.
AT+CGNSCMD=0,"$PMTK220,100*2F"
OK
Voila, the time stamp being shown from the output data, was going up in 0.1s steps. Brilliant. This meant that the GPS HAT would provide GPS position data at 10Hz, which is what was needed for more accurate data capture. 1Hz would not have been a high enough update rate, imagine how far the car would travel at 150MPH in just 1 second. I did then try even higher update frequencies, but the SIM868 chip just replied with an OK, and the timestamp didnt increase, so it's definitely topped out at 10Hz (10 times a second)
This animated GIF shows the Waveshare HAT, running at 10Hz, and the green LED flashes on and off to show it sending the data through the UART to the Pi.
Coding with Python
So the next step was to put a Python script together, to send the PMTK startup codes to the HAT board, rather than use a minicom terminal session, and so I had a go at writing my first Python script.Sending commands to the HAT from your Python program
So we've had a bit of a play with the minicom terminal, typing in AT codes and pressing Enter, and the HAT receives the command, processes it, and spits out a response, but how do we do that from Python? How do we send the commands to the Pi HAT?We use the Python ser.write command. This tells Python to write to the serial port. The syntax, once the serial port is opened, is to place the string to be sent, followed by a carriage return & line feed symbol, which in Python is written as \r\n surrounded by quotation marks.
In computing speak, this is known as a CRLF.
If we dont send the CRLF after the AT command string, the string isnt executed by the HAT. It just sits in the input buffer and is not executed until the next CRLF is received.
eg
ser.write("AT\r\n")
So lets open the serial port to the HAT, from Python, and send a string.
import serial
ser = serial.Serial("/dev/ttyS0",115200) #ttyS0 is the port on the Pi3, it may be ttyAMA0 on the older Pi's
ser.flushInput()      #clear the input buffer
ser.flushOutput()     #clear the output buffer
ser.timeout = 5       #set the timeout on the serial port to 5 seconds
ser.write("AT\r\n")   #send the AT command
str = ser.readline()  #read a line of data from the serial port
print str             #print the response from the SIM868 chip
The piece of code above, tells Python that you are using the /dev/ttyS0 serial port, at 115200 baud, and the ser.write command sends the AT code, with the carriage return & linefeed on the end.
The HAT, if powered on, will return with an 'OK'. Reading the data from the serial port, to examine if it is the expected return code, you would use ser.readline()
str = ser.readline()  #read a line of data from the serial port
print str             #print the response from the SIM868 chip
I have spent many hours trying to work out the optimal way to send codes to the HAT, in the shortest space of time, and in some cases, you just cant rush the SIM868 chip. One command for example, AT+CIICR initialises the GPRS protocol, and it does take up to 5 seconds sometimes before the SIM868 returns with an OK. So I have written a function, sendCmdToSerPort(mssg,resp,tOut) which expects three parameters, the code being sent, the expected code returned, and the length of time to wait for the code is returned, and this takes all of the guess work out of reading, waiting, and analysing the return codes, which makes for a happier HAT, and a happier owner.
NMEA Output
Every update from the GPS chip, involves information output in what are known as sentences. Each sentence encodes specific pieces of information seperated by commas, which has a different meaning based on the first 5 (or so) characters. The exact specification is proprietary, but there is a particularly good online reference if you're curious. Luckily, the pynmea2 library takes care of much of this for us. There is a python library already written for interpreting the NMEA sentences sent from the GPS HAT, so you will need to install this and include the library in the Python, and experiment with reading the data back and making sense of it.If you dont already have pip installed, do the following (pip is a package management system used to install and manage software packages written in Python)
pi@raspberrypi:~ $ sudo apt-get install python-pipTo install the NMEA library for Python, run
pi@raspberrypi:~ $ sudo pip install pynmea2To collect the data, and use the Python NMEA library to parse it, the following Python code can be used:
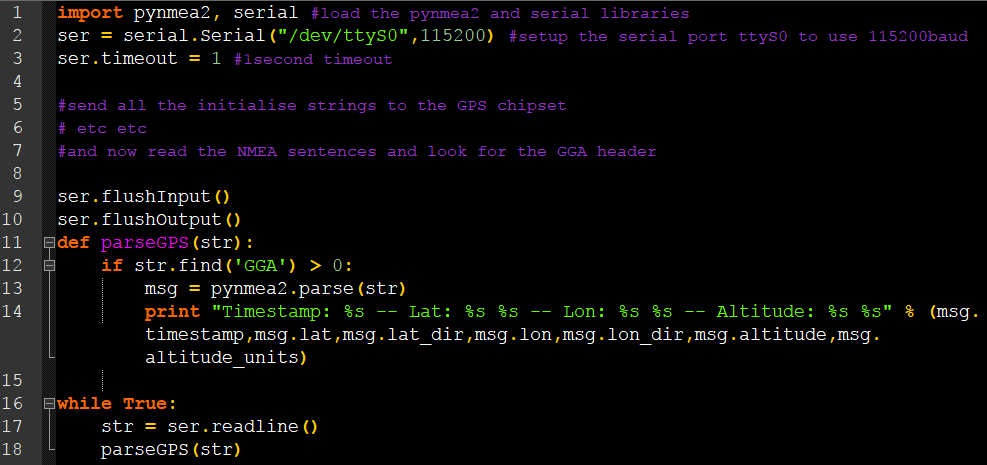
The code above finds the sentence containing the GGA data, and then prints the parsed information to the screen. GGA is used for the essential fix infornation, so it includes the position information. The next improvement is to parse the VTG sentence as that contains the actual vehicle speed in kph.
NMEA Sentences
GGA - essential fix dataGSA - accuracy of the satellite fix, number of satellites being used, DOP (Dilution Of Precision)
RMC - NMEA has its own version of essential gps pvt (position velocity time) data.
VTG - Velocity made good. Ground speed knots, ground speed kph
GSV - Detailed satellite data, ie # of satellites in view
An example of captured GPS Data: [coordinates have been obfuscated]
$GNGGA,122752.000,5999.155767,N,00999.797128,W,1,5,1.82,113.927,M,47.460,M,,*56
$GPGSA,A,3,07,02,30,09,,,,,,,,,2.07,1.82,0.99*03
$GLGSA,A,3,82,,,,,,,,,,,,2.07,1.82,0.99*1A
$GPGSV,2,1,05,07,63,125,34,09,48,075,30,30,47,171,35,02,43,243,31*7B
$GPGSV,2,2,05,06,,,28*70
$GLGSV,2,1,06,66,65,073,,67,50,304,,83,27,322,,82,26,263,29*6B
$GLGSV,2,2,06,65,10,102,,81,01,222,*68
$GNRMC,122752.000,A,5999.155767,N,00999.797128,W,0.18,12.10,301217,,,A*59
$GNVTG,12.10,T,,M,0.18,N,0.33,K,A*18
Every sentence ends with a checksum value (* followed by number), to verify the integrity of the information in the sentence.
Some sentences are starting with GP and others with GL. The GL sentences are based on whats known as LORAN Data (LORAN is short for LOng RAnge Navigation). We are only interested in the sentences starting with GP.
Lets look at VTG in more detail:
$GNVTG,12.10,T,,M,0.18,N,0.33,K,A*18This shows: $GPVTG, cogt, T, cogm, M, sog, N, kph, K, K*cs
12.10	course over ground true (cogt)
T	True (fixed field)
[null]	course over ground magnetic (cogm) not output (empty)
M	Magnetic (fixed field)
0.18	Speed over ground in knots (sog)
N	(fixed field)
0.33	Speed (kph)
K	kilometres per hour (fixed field)
A*18	checksum
<CR><LF>End of message
So the VTG sentence contains the actual vehicle speed, kph, so this sentence needs parsing by the Python program to pull that key piece of information out, therefore we shall ignore speed over ground in knots (sog)
And now look at the RMC data in more detail
$GNRMC,122752.000,A,5999.155767,N,00999.797128,W,0.18,12.10,301217,,,A*59This shows:
122752.000	Fix taken at 12:27:52.000 UTC
A		Status A=Active or V=Void
5999.155767,N	Latitude 59 deg 99.155767' N
00999.797128,W	Longitude 00 deg, 999.797128' W
0.18		Speed over ground in knots
12.10		Track angle in degrees True
301217		Date - 30th December 2017
What we need to do is concatenate the relevant information to a single string, and write it to a file. The file could be closed automatically when the speed is <1kph, and then a new file is created when the speed goes >1kph. This way we would end up with small files, but maybe the thing to do is to only list the files that have more than say 5s of data in them, to save the user having to discard them.
Before we get started though, to reduce the amount of serial traffic, lets turn off the sentences that we're not interested in. The following PMTK command tells the SIM868 chipset to only output RMC, GGA and VTG sentences.
AT+CGNSCMD=0,"$PMTK314,0,1,1,1,0,0,0,0,0,0,0,0,0,0,0,0,0,0,0*29"So I now have the Pi parsing the GGA and VTG data, and writing them to a text file, with a time stamp for the filename.
eg It writes:
/home/pi/capture_2018-01-18-16-04-32.txt
G-Bot4k gps data capture test at 10Hz
epochTime,gpsTime,gpsQual,gpsNumsats,gpsLat,gpsLatDir,gpsLon,gpsLonDir,gpsAltitude,gpsSpeed(kph),gpsCourse
151629147255,16:04:32.1,1,10,5253.335231,N,00128.632704,W,52.119,17.9,176.87
151629147283,16:04:32.2,1,10,5253.334834,N,00128.632824,W,51.918,19.78,179.12
151629147312,16:04:32.3,1,10,5253.334575,N,00128.632785,W,51.9,18.88,176.38
So the next step was to make the program wait for the Satellite Fix to take place, to avoid writing zeros to the file, and this is determined by the gpsQual flag. While the value returned 0, no fix has taken place, and there is no data to process. As soon as the flag changes to 1 or higher, the program starts processing the NMEA data, and writing to file. It can take a very long time (Minutes) to get a satellite fix when starting from a cold start. I will need to work out how to avoid cold starting the GPS circuitry every time.
KML output
The logical thing to do was to have the Python script create a second file, a KML file, that allows the track data to be read in to Google Maps, to overlay the course on top of the map, to show the vehicles path. This took a bit of digging, as the KML/XML file format isnt that well documented, but after a while I managed to get the file format right, and Google Maps will now let me import the KML file direct from the Pi, and it then shows the vehicles course.Developing the software
The software is being developed under Idle Python 2.7.14, and is now up to the version shown below. I am working on a new control loop, to allow the program to close open files when the vehicle speed is zero for more than 5seconds, and a few other options will also be available.#v7 wait for hat board to be turned on, then commence logging #v8 when hat board turned off, close the open files and exit program. # Log raw nmea data to dbg file. # Send nmea sentence string just before capture begins, to turn on vtg,gga,rmc (was being ignored) #v9 Removed illegal colon chars from generated filename to allow files to be copied using Explorer # Epoch calculation error fixed # Created write_kml_header routine #v10 Shutdown Pi and power off when HAT turned off #v11 Fixed gga.timestamp string length # Added number of satellites to output file gps.num_sats #v12 I2C interface, read analogue voltages from the AB Electronics Pi ADC #v13 Read the ADC channels between the data arriving from the gps hat
ADC Convertor
For this project to progress, I've added an AB Electronics ADC (Analog to Digital Convertor) HAT board, stacked beneath the GPS HAT, on the same GPIO header connector. This allows the Pi to capture the analogue input voltages, from the four linear potentiometers that I've fitted to the shock absorbers on the car. This data is time stamped, and saved to the Pi's disk, and after a run, the intention is to get the Pi to email me the file automatically to my gMail account, allowing me to compare the G-bot data alongside the data captured by the car's Life ECU, which is also time stamped using GPS.To access the I2C connected ADC board, we need to enable I2C on the Pi. To do that, run the raspi config utility, and enable I2C
pi@raspberrypi:~ $ sudo raspi-configOnce that is done, run the following command to make sure that the I2C libraries are installed (They should be)
lsmod | grep i2cIf you can see items starting with i2c, you can then run the i2cdetect command to see the i2c card address.
sudo i2cdetect -y 1You should see the following
     0  1  2  3  4  5  6  7  8  9  a  b  c  d  e  f
00:          -- -- -- -- -- -- -- -- -- -- -- -- --
10: -- -- -- -- -- -- -- -- -- -- -- -- -- -- -- --
20: -- -- -- -- -- -- -- -- -- -- -- -- -- -- -- --
30: -- -- -- -- -- -- -- -- -- -- -- -- -- -- -- --
40: -- -- -- -- -- -- -- -- -- -- -- -- -- -- -- --
50: -- -- -- -- -- -- -- -- -- -- -- -- -- -- -- --
60: -- -- -- -- -- -- -- -- 68 69 -- -- -- -- -- --
70: -- -- -- -- -- -- -- --
The output above shows that the ADC is using the address 68h and 69h. The table is in hexadecimal format, so 68h is 104 in decimal, and 69h is 105 decimal.
Once the card is shown to be working, you can then install the AB Electronics libraries for the ADC card, and your Python code can be developed to extract the data from it. I now have the ADC card running at 160 samples a second, at 12bit accuracy. This is hopefully more than accurate enough to make for useful data from the car. Here is a small sample of the output from my Python program. Although the ADC has 8 channels, I'm just focusing on four channels for the time being. (They show 0.00000 as I dont actually have the inputs connected to anything so there is no voltage to read)
G-Bot4k adc data capture test at 40Hz
epochTime,adcCh1,adcCH2,adcCh3,adcCh4
151629147255,0.000000,0.000000,0.000000,0.000000
151629147256,0.000000,0.000000,0.000000,0.000000
151629147258,0.000000,0.000000,0.000000,0.000000
151629147261,0.000000,0.000000,0.000000,0.000000
151629147263,0.000000,0.000000,0.000000,0.000000
151629147265,0.000000,0.000000,0.000000,0.000000
151629147267,0.000000,0.000000,0.000000,0.000000
151629147270,0.000000,0.000000,0.000000,0.000000
151629147273,0.000000,0.000000,0.000000,0.000000
151629147275,0.000000,0.000000,0.000000,0.000000
This file format is called CSV, or comma seperated values. The Excel Macros I am writing will import the ADC Log file, and automatically place the channel data in to the appropriate columns. Because the GPS data is also saved with the Epoch time, it will be very easy to stich the two files together.
Below is the sample from the GPS log file, which shows that each line is started with the Epoch time, which will make it easy to stitch the two output files together.
/home/pi/capture_2018-01-18-16-04-32.txt
G-Bot4k gps data capture test at 10Hz
epochTime,gpsTime,gpsQual,gpsNumsats,gpsLat,gpsLatDir,gpsLon,gpsLonDir,gpsAltitude,gpsSpeed(kph),gpsCourse
151629147255,16:04:32.1,1,10,5253.335231,N,00128.632704,W,52.119,17.9,176.87
151629147283,16:04:32.2,1,10,5253.334834,N,00128.632824,W,51.918,19.78,179.12
151629147312,16:04:32.3,1,10,5253.334575,N,00128.632785,W,51.9,18.88,176.38
151629147321,16:04:32.4,1,10,5253.334273,N,00128.632770,W,51.847,19.01,177.61
151629147329,16:04:32.5,1,10,5253.333976,N,00128.632753,W,51.811,19.02,177.86
151629147337,16:04:32.6,1,10,5253.333665,N,00128.632734,W,51.773,19.15,178.29
151629147346,16:04:32.7,1,10,5253.333346,N,00128.632704,W,51.695,19.22,178.35
151629147354,16:04:32.8,1,10,5253.333046,N,00128.632698,W,51.609,19.43,178.51
151629147363,16:04:32.9,1,10,5253.332749,N,00128.632692,W,51.527,19.81,178.6
151629147371,16:04:33.0,1,10,5253.332448,N,00128.632674,W,51.482,19.98,179.34
We are also considering sending the data to the cloud, as the car is being driven, to give real time information on the track position and performance of the car. With the Pi, and a good phone signal, pretty much anything is possible.
Catching pynmea2 parse errors
Don't you just hate it when the NMEA string is missing the checksum from the end? It does happen, with no warning, and the call to parse the string using the Pynmea2 library, will result in a fatal error, and a program crash. Not what you need when racing around a circuit. So how do we tell Python to ignore any errors with the Pynmea2 parse code? This is where try: except: comes in. We simply preceed the call to the Pynmea2 code, with a try: statement, and if the statement causes an error, the code drops down to the except: branch, and continues without crashing.if str.find('GGA') > 0:
try:
msg = pynmea2.parse(str)
except:
print "pynmea2 parse error ignored."
Latest News
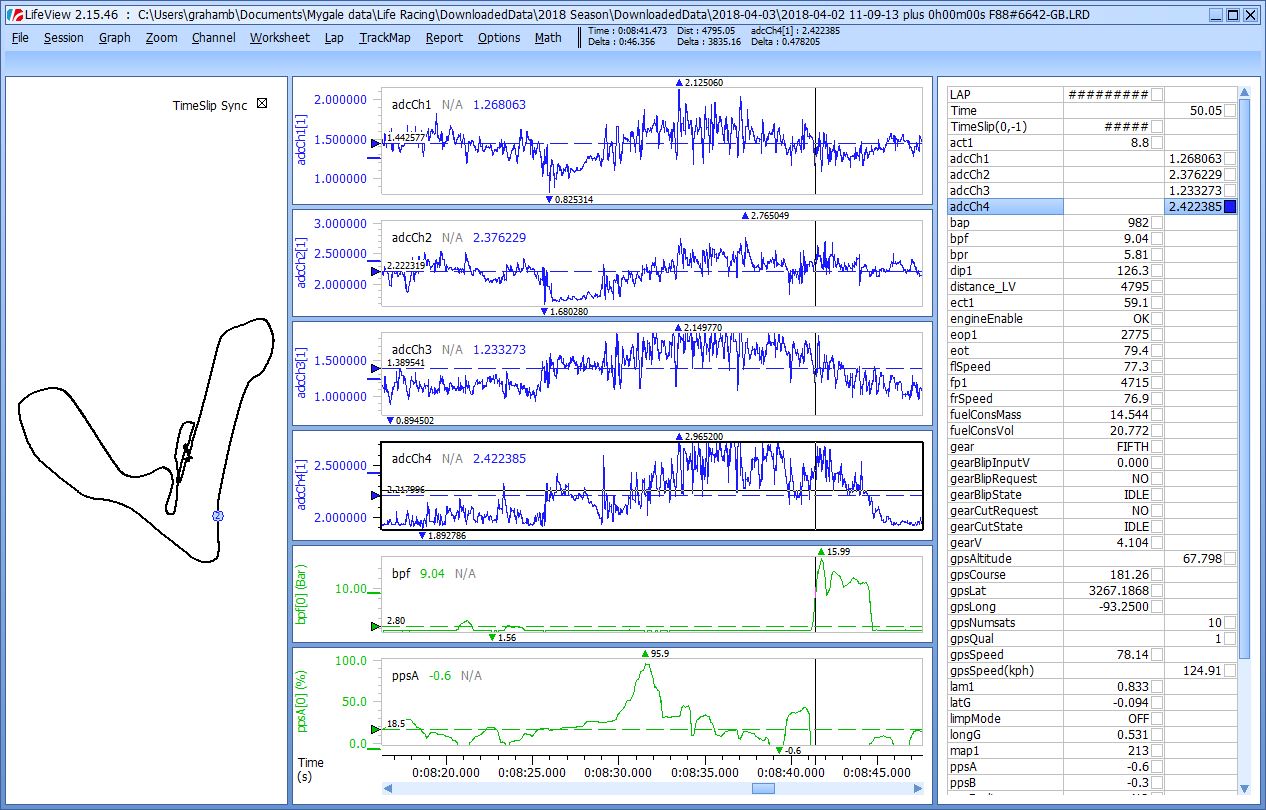
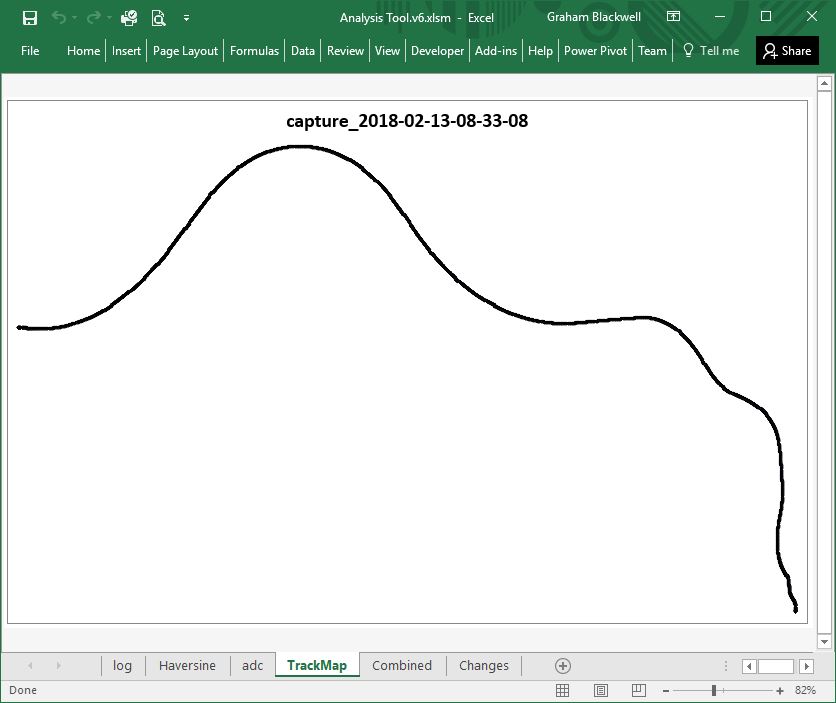
April 2018: The datalogger was used on the car for the first time at the Easter Croft Sprint, and it worked perfectly. The map and data captured are shown below. Excel was used to process the raw data and generate the track map, and the data was then exported in CSV format, and loaded in to LifeView alongside the data captured by the ECU on the car. It shows the voltages from the four suspension potentiometers for the wet lap around Croft.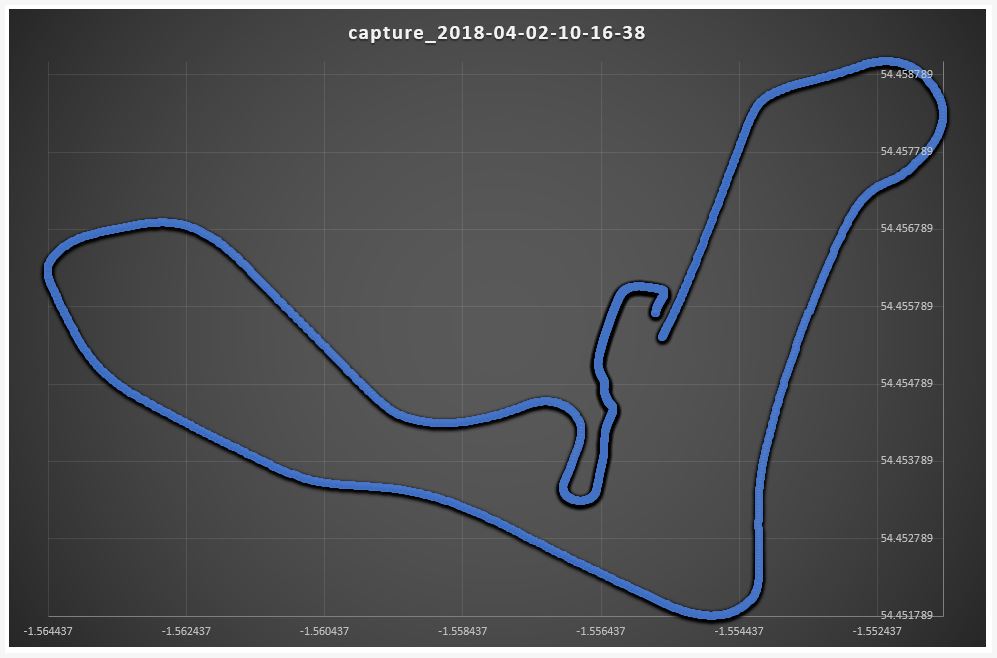
Excel Macro development
The macros I've developed in VB, all run under Microsoft Excel 2016. They basically allow you (the user) to import the two log files for a run, combine them back together, and export the resultant combined file to CSV again, to allow the file to be read and analysed using a third party analysis tool (ie LifeView).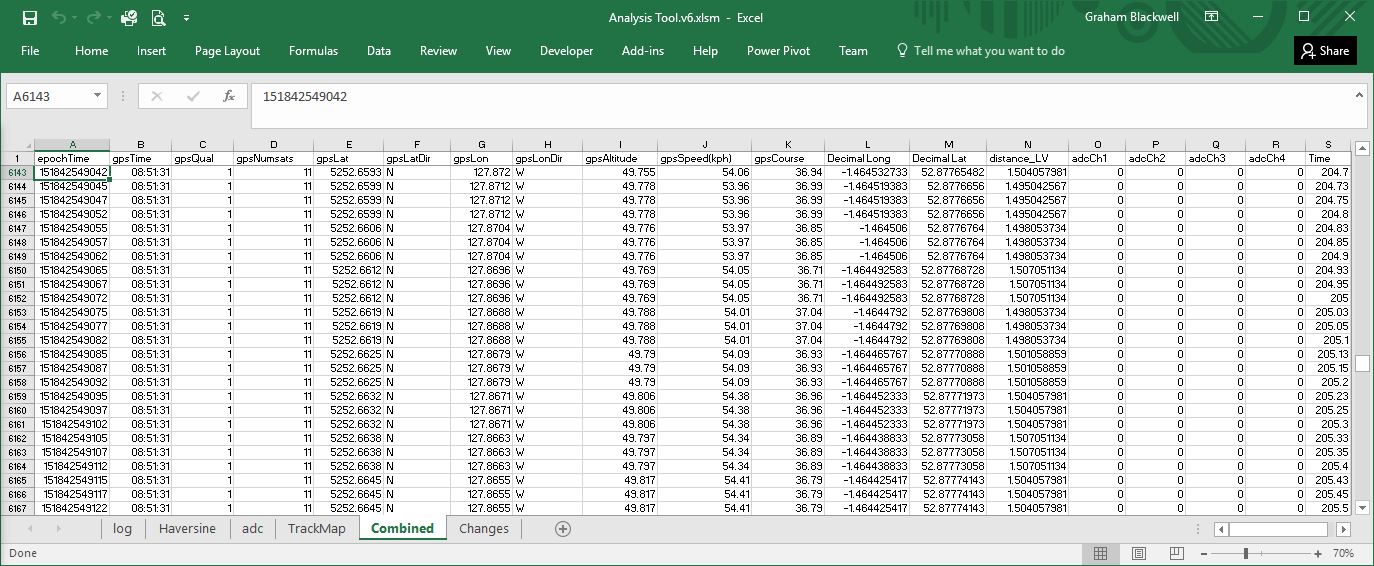
epochTime - This is the number of seconds, that have elapsed since January 1st 1970. Also known as Unix time. Every GPS sample, and ADC sample, are saved by the Pi to file, with the epochTime that the sample was taken. The epochTime is accurate to 1/100th of a second.
gpsTime - This is the time provided by the GPS Satellite network, and it is very accurate.
gpsQual - This flag is 1, to indicate that the GPS chip has enough satellites in view to provide a fix.
gpsNumsats - The total number of satellites in view. The higher the number the better, and in testing it is typically 11 satellites.
gpsLat - GPS Latitude, the geographic coordinates that specifies the north-south position of a point on the Earths surface
gpsLatDir - Either N or S, for North and South
gpsLon - GPS Longitude, the geographic coordinate that specifies the east-west position of a point on the Earths surface
gpsLonDir - Either E or W, for East and West
gpsAltitude - The altitude of the vehicle in metres above sea level
gpsSpeed(kmh) - The speed over ground, of the vehicle, in KMH
gpsCourse - The heading of the vehicle, in degrees
DecimalLong* - The longitude converted to decimal, which is required for some display systems, such as Google KML
DecimalLat* - The latitude converted to decimal, which is required for some display systems, such as Google KML
distance_LV* - The Haversine formula is used to calculate the distance travelled, in metres, between two GPS coordinates. When the Haversine formula returns a distance of 0, the distance is instead derived from the speed / 3.6 / 10 (60 KMH = 16.67M/S)
adcCh1 - channel 1 from the A to D convertor
adcCh2 - channel 2 from the A to D convertor
adcCh3 - channel 3 from the A to D convertor
adcCh4 - channel 4 from the A to D convertor
Time* - the elapsed time since the car started moving, in 1/100ths of a second
Note: Headings marked * are calculated by the Macro's, and not by the Pi. For example, Haversine, DecimalLat and DecimalLong are all created during the GPS import process within Excel.
The toolbar
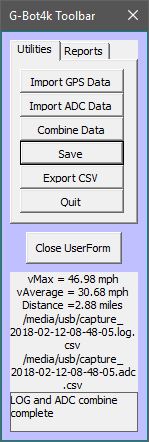 This is the control interface for the macros within the spreadsheet. Here you can import the log/GPS data and ADC data files, combine them, and export them.
You can also of course, save the current data within the spreadsheet, and the next time the spreadsheet opens, the filenames and previous performance statistics are read from the registry, and displayed on the control interface.
When a new log/GPS file is imported, the performance stats are recreated, and again, shown in the toolbar and stored in the registry.
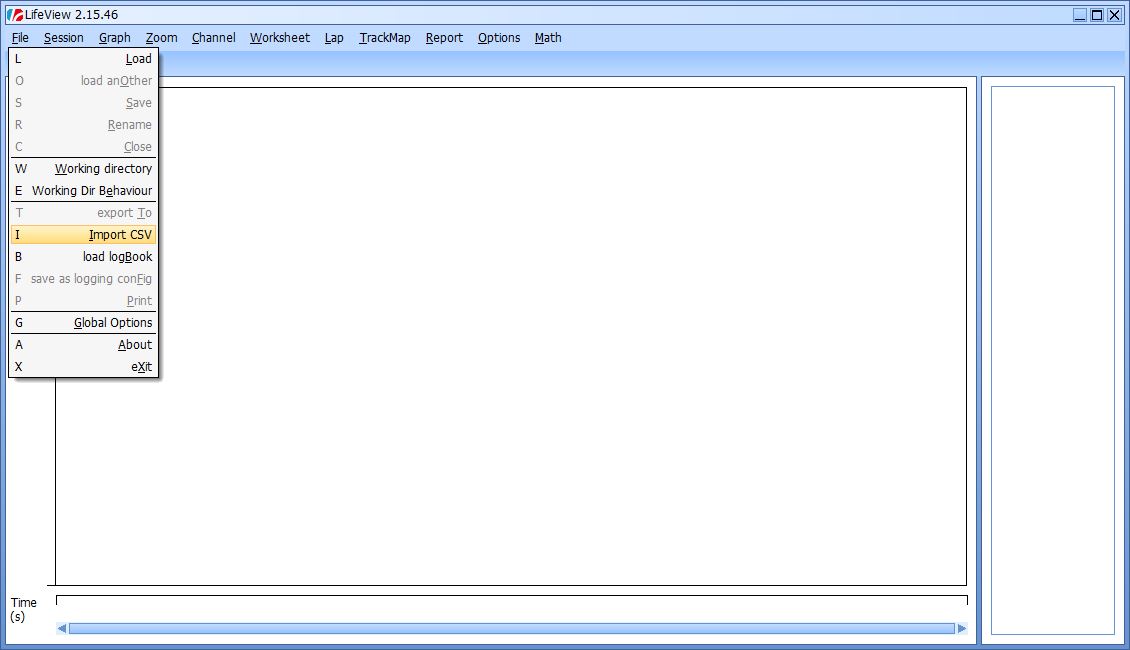
Loading the data in to Lifeview
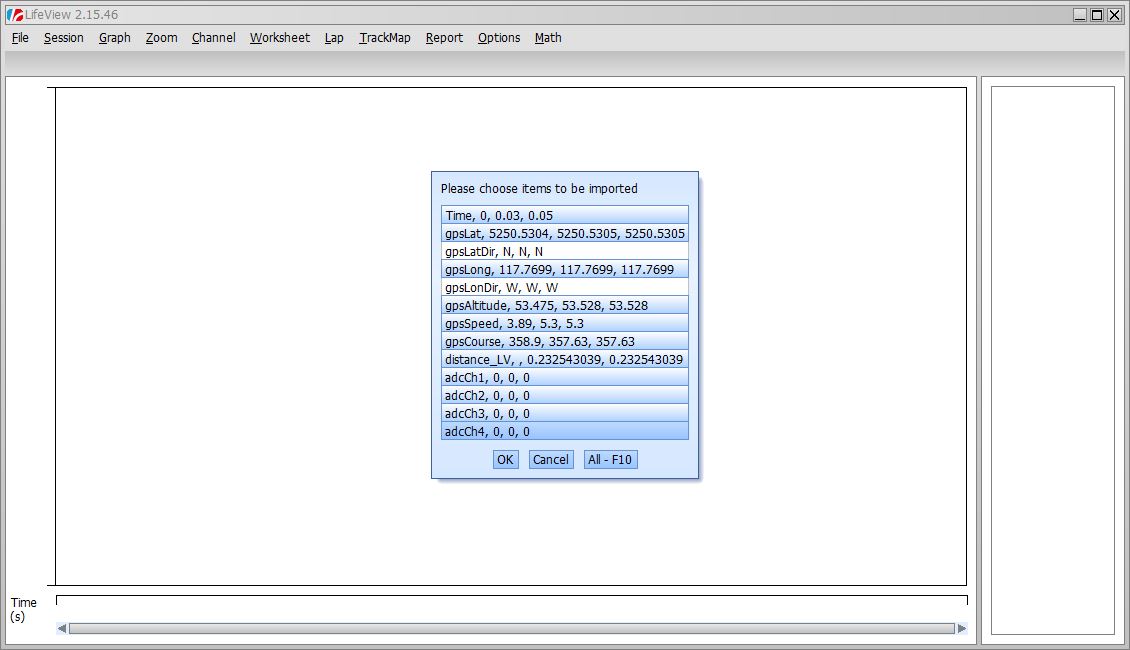
Here comes the part you're probably most interested in. The Excel spreadsheet is just required to produce the data file that can then be loaded in to a third party analysis tool. I'm using Life Racing's LifeView, simply because its what came with the Mygale and I'm used to using it.Having created a combined CSV file, lets open up LifeView and import it. Navigate to the folder containing the combined CSV file, and import it in to LifeView.
You'll see that the LifeView software wants to know which of the CSV columns contains the TIME. Lets select Ttime.
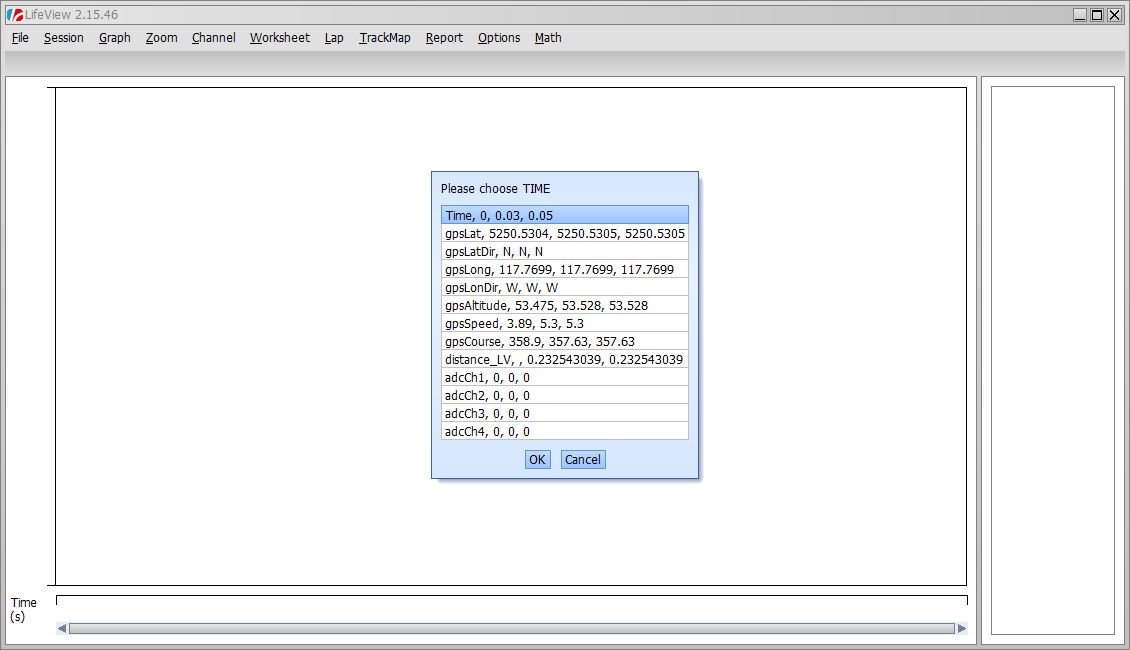
Now LifeView wants to know which columns you want to import. Select all except gpsLatDir and gpsLonDir (these appear to crash LifeView). Select OK and the columns will import.
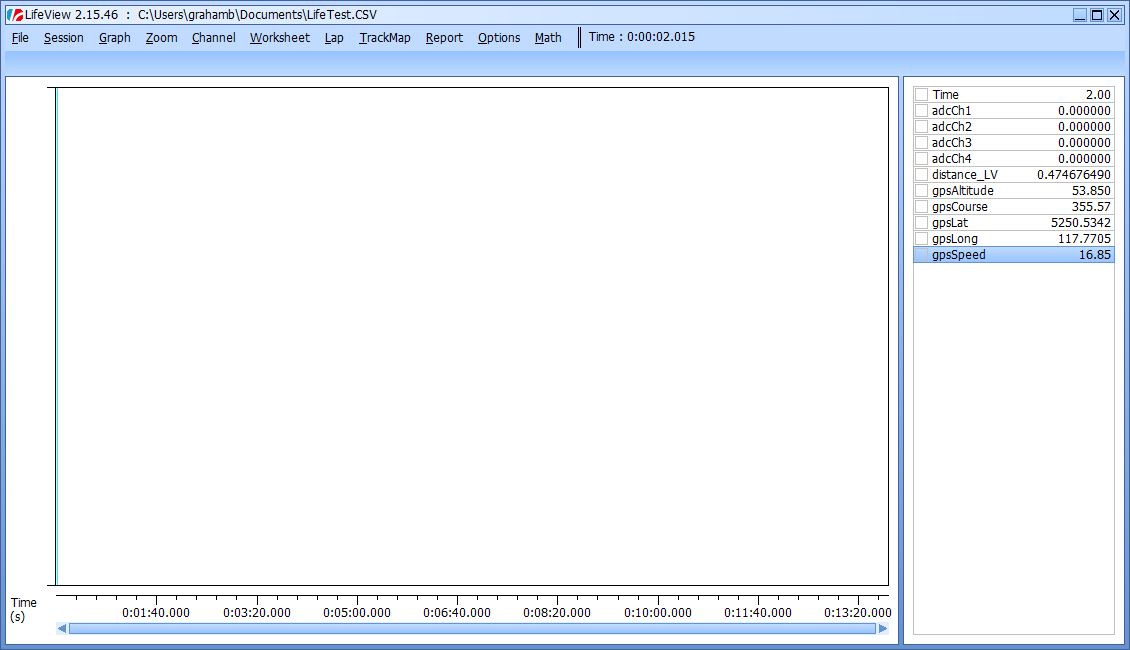
So now we have the data loaded, we can select the channels on the right and they will be displayed on the graph. The time axis along the bottom of LifeView shows that the log file has been read correctly, as in this example, there were 13 and a bit minutes worth of data. Always a good sign :)
Here I have selected gpsSpeed, in KMH, and LifeView displays the data in a graph.
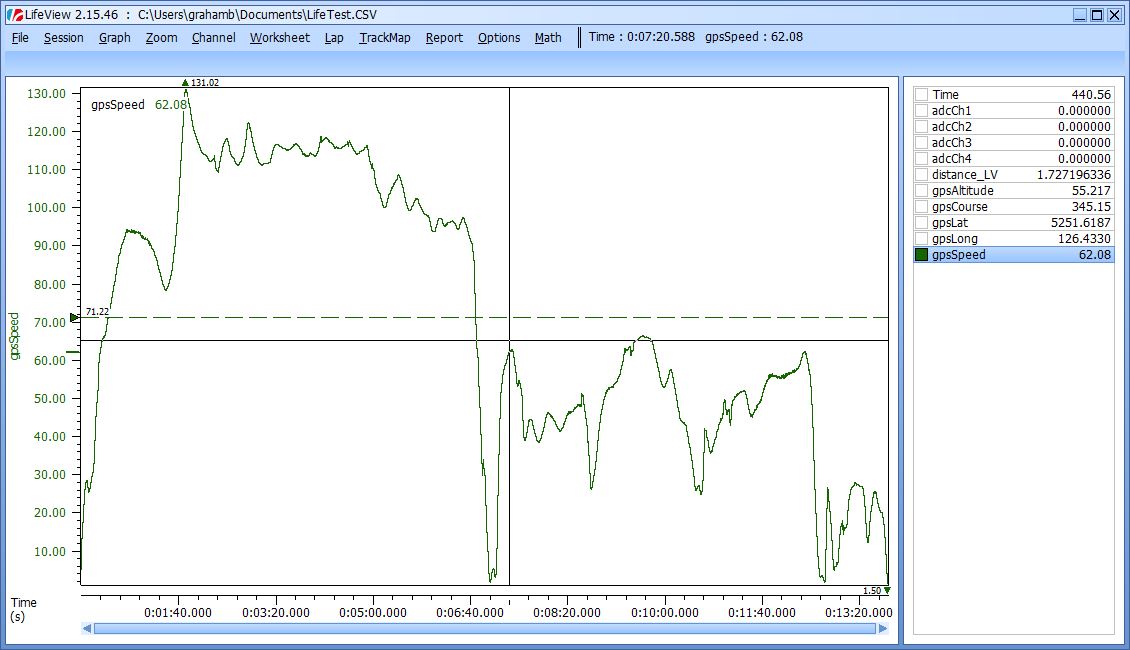
You can also do the same thing with the four adcChannels, and load in the ECU data for the same time period, and LifeView will display the Pi captured data, alongside the Life ECU captured data, which is about as perfect as it gets.
Track Map
Unfortunately, one feature not supported by LifeView, is the Track Map generation from imported CSV files. I have even contacted Life Racing about this, but its not something they support. However, they do suggest that an XY graph be plotted instead, using gpsLong and gpsLat for the XY coordinates, and that works quite well. Select Report, XY Plot, and a new graph appears. Click X Unassigned, and select gpsLong, then click Y Unassigned and select gpsLat. Once you have autoscaled both axis, you should see something that resembles the track you have driven. You can then select Z Unassigned, and select gpsSpeed to show the speeds reached around the circuit. The only issue I can find with doing this, is that the trackmap is inverted. In Excel, I also provide a trackmap facility, but I have to invert the Y axis for it to work properly. Again, this isnt something the LifeView software does.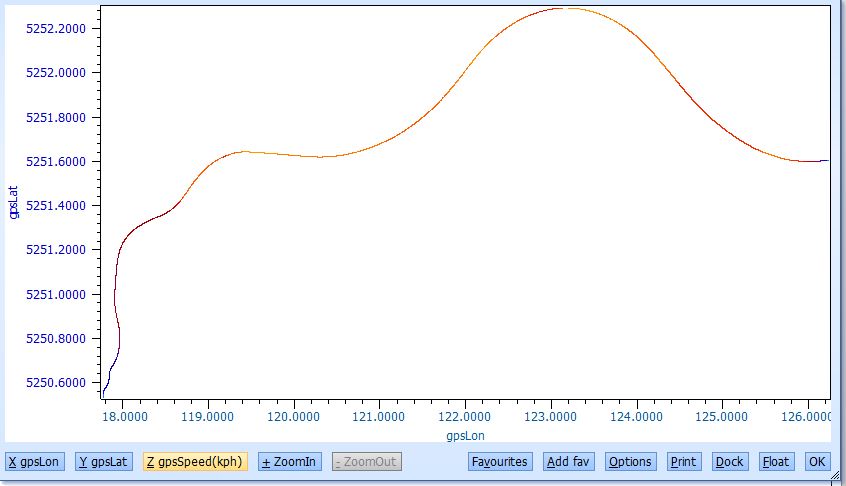
www.g-bot4k.com is live
I'm going to put a couple of web pages together, to promote the project. The domain name is now live, and I've a landing page. So far so good.Click here to visit www.g-bot4k.com
Links
AT CommandsRaspbian Stretch
Waveshare GSM/GPRS/GNSS/Bluetooth HAT Expansion Board with Low-Power Consumption Based on SIM868
GLONASS satellite network
PMTK Codes
GPS reference
Python pynmea2 library
