Pycom Project Page
LastSigFox Vehicle Battery Monitor

I need to monitor the voltages of the batteries in the van, which is kept in storage. A solar panel on the dashboard recently failed, and the battery drained flat, so flat I couldnt even jump start the engine. So I had a search for devices that monitor batteries and upload data to the cloud, and they're a) few and far between, and b) require expensive cloud subscriptions. Not my cup of tea.
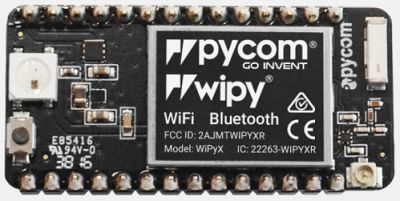 I was given a Pycom WiPy 2.0 a few years ago, and it got me wondering if I could develop my own device to monitor voltages. The Pycom WiPy microcontroller needs a USB power supply, and a WiFi connection to send data, so I set about developing the code in micropython, to make it send regular updates to the cloud. But send the updates where? And send what? And how often? And how would I view the battery status?
Setting up the Pycom
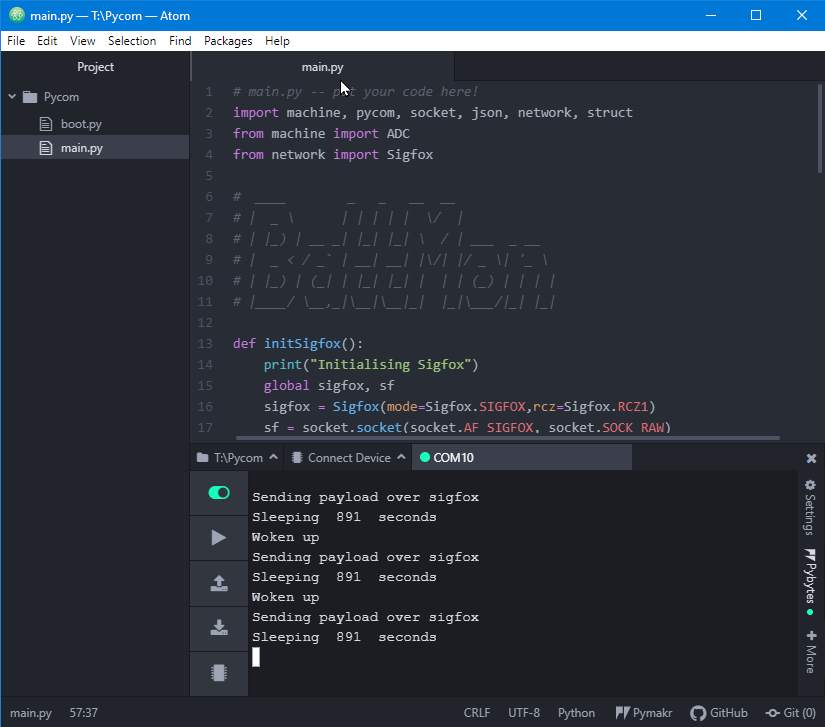
How exactly do you power up and connect to the microcontroller? Well, it simply connects to the PC using a USB lead. The WiPy (and SiPy) device takes its power from the USB cable, so when the device is deployed, you'll need to ensure a USB lead is available with permanent power.I installed a package called Atom. This is a text editor / development tool, and allows you to connect to the microcontroller, to upload your programs to it, and to monitor the output from it. If you print() something in the micropython code, the output will be displayed in Atom.
Note: Atom also needs the pymakr plugin, to allow it to interface to the Pycom device. Go visit the Pymakr Plugins page, and download the plugin.
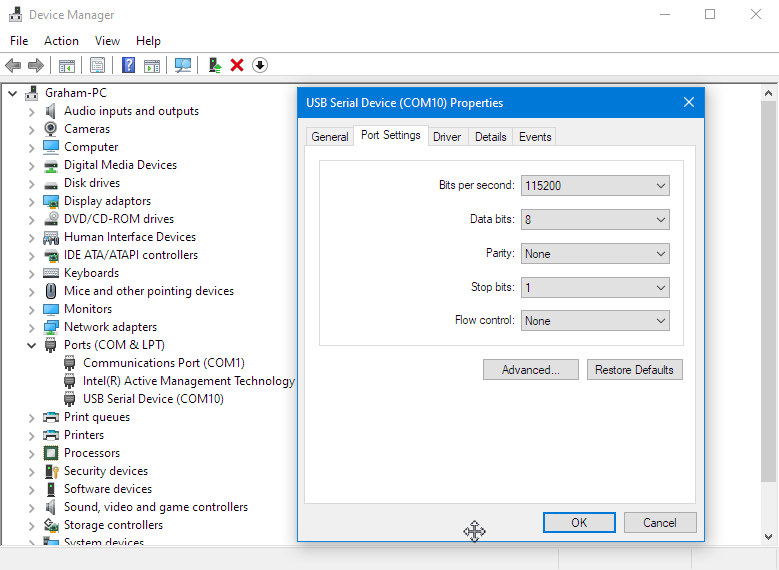
Note: The USB connection to the microcontroller, will automatically create a COM (serial) port in Windows, which the Atom software uses to communicate over. The baud rate of the COM port created, will only be 9600 baud. It will need changing to 115200 baud, before you will be able to communicate. The baud rate is changed by going in to the device manager on Windows, selecting Ports, then the USB Serial Device (COM) port, and selecting 115200 from the drop down list. Once done, Windows will remember the setting, and you shouldnt have any issues connecting to the Pycom device.
Now you have Atom installed, the Pymakr plugin installed, and the USB COM port configured, you should be able to see the >>> chevrons on the Atom editor, which indicates that the device is connected and waiting for you to start coding.
Programming the pycom microcontroller
I reckoned on sending epoch, two voltages, and the device name. That should do it. My website is hosted on a platform that allows developers to create mySQL databases, so I logged in, created a database, a table, and four fields in that table.The next step was to insert data in to the database. Thats easy using PHP. So I created a PHP file on the webserver, to accept four values, and insert them in to the database table. Again, quite straight forward. I used JSON to format the data being sent, as JSON was something I wanted to gain more experience of, and it was very easy to do. You just create the structure between curly braces, and the transfer adopts that format. The PHP code accepts, epoch, device name, batt1, batt2.
Now the tricky bit was to construct the POST in micropython, to send the data to the PHP file, using the same JSON structure. Again, took a few goes, but it was working, and the pseudo 'made up' battery values were appearing in the database table.
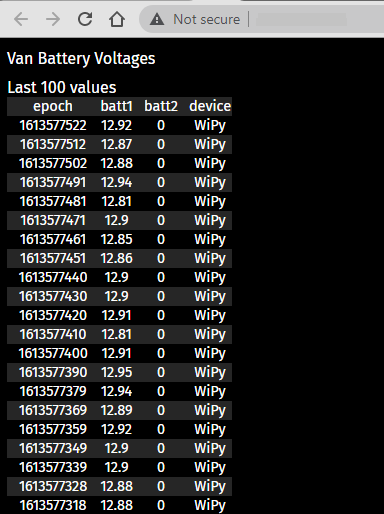
Then I created another PHP page, to query the database table, and extract the last 25 values. This gave me a view as to what the mySQL database was receiving. So far so good.
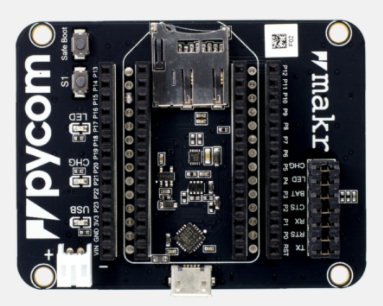 The next task was to interface the analogue inputs on the WiPy board to the batteries that I wanted to monitor. I bought a Pycom Expansion board 3.0, which gave me two rows of header pins to allow the wires to be safely attached to the two analogue input channels. But, there must be a voltage divider sat in between the battery being monitored, and the analogue input, as the analogue input is limited to a maximum of 3.3V. I needed a 5:1 divider, to drop the battery voltage from a maximum of say 15V, down to 3V, and fortunately there are many companies selling ready-made voltage dividers on ebay, so I bought a pair and waited a few days for them to arrive.
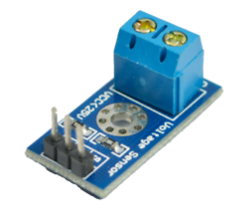 With the dividers in place, I wrote the code to read the two analogue channels, and did some rough maths to convert the 11bit values in to voltages. I've got it approximately right, but as I'm only using one signficant digit, I need to ensure that the voltages reported, are accurate.
Linearity
The ADC convertor in the Pycom range of microcontrollers, isnt exactly linear. The ADC will divide the 3.3Vin by 4096, so in Python we multiply the ADC reading by .00081V to turn it back in to a voltage. With the voltmeter across the battery, I soon realised that the ADC was returning the wrong values for the input voltage. So I hooked up a voltage source, a digital power supply, to Vin, and swept from 0V to 15.5V in 0.5V steps, recording the ADC values. When plotted, you can see that the graph is anything but linear.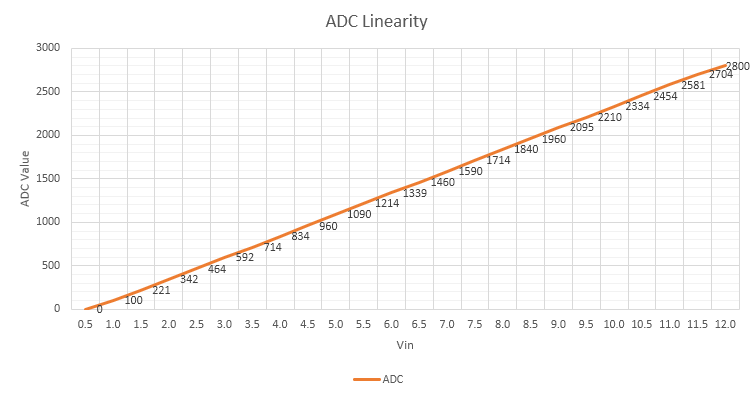
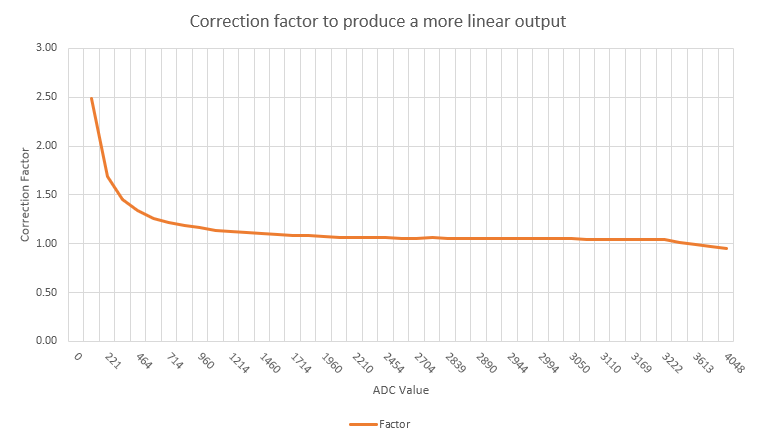
All is not lost though. I can make the values linear by sweeping through the voltage range again, and comparing the ADC value with what it is meant to produce for a linear graph, and from that work out a correction factor to apply to the ADC value. So I did this for 0-15.5V, focusing on 100mV steps from 12V to 13.5V to increase the accuracy in that range, and wrote a function in python to apply the correction for the given ADC values. Now, the voltage reported by the Pycom is almost 100% accurate.
So now the WiPy is sending the battery voltages, to the PHP page, which is then inserting them in to the mySQL table, and the results page is then displaying the values stored in the database.
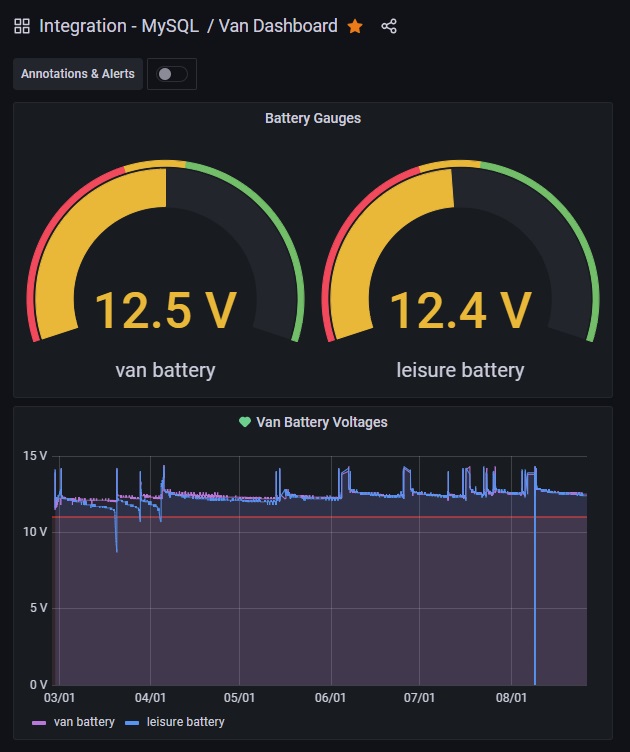
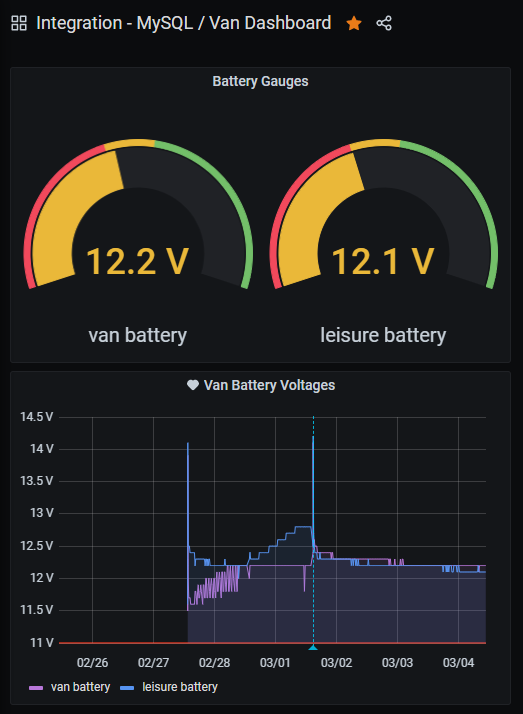
The next step is to visualise the data as graphs. I logged in to Grafana, and setup an account, and entered the mySQL login details to allow Grafana to read the database, and produce graphs. Grafana is a really powerful system, graphs are customisable, and I've settled on two Volt Meters, and a graph below.
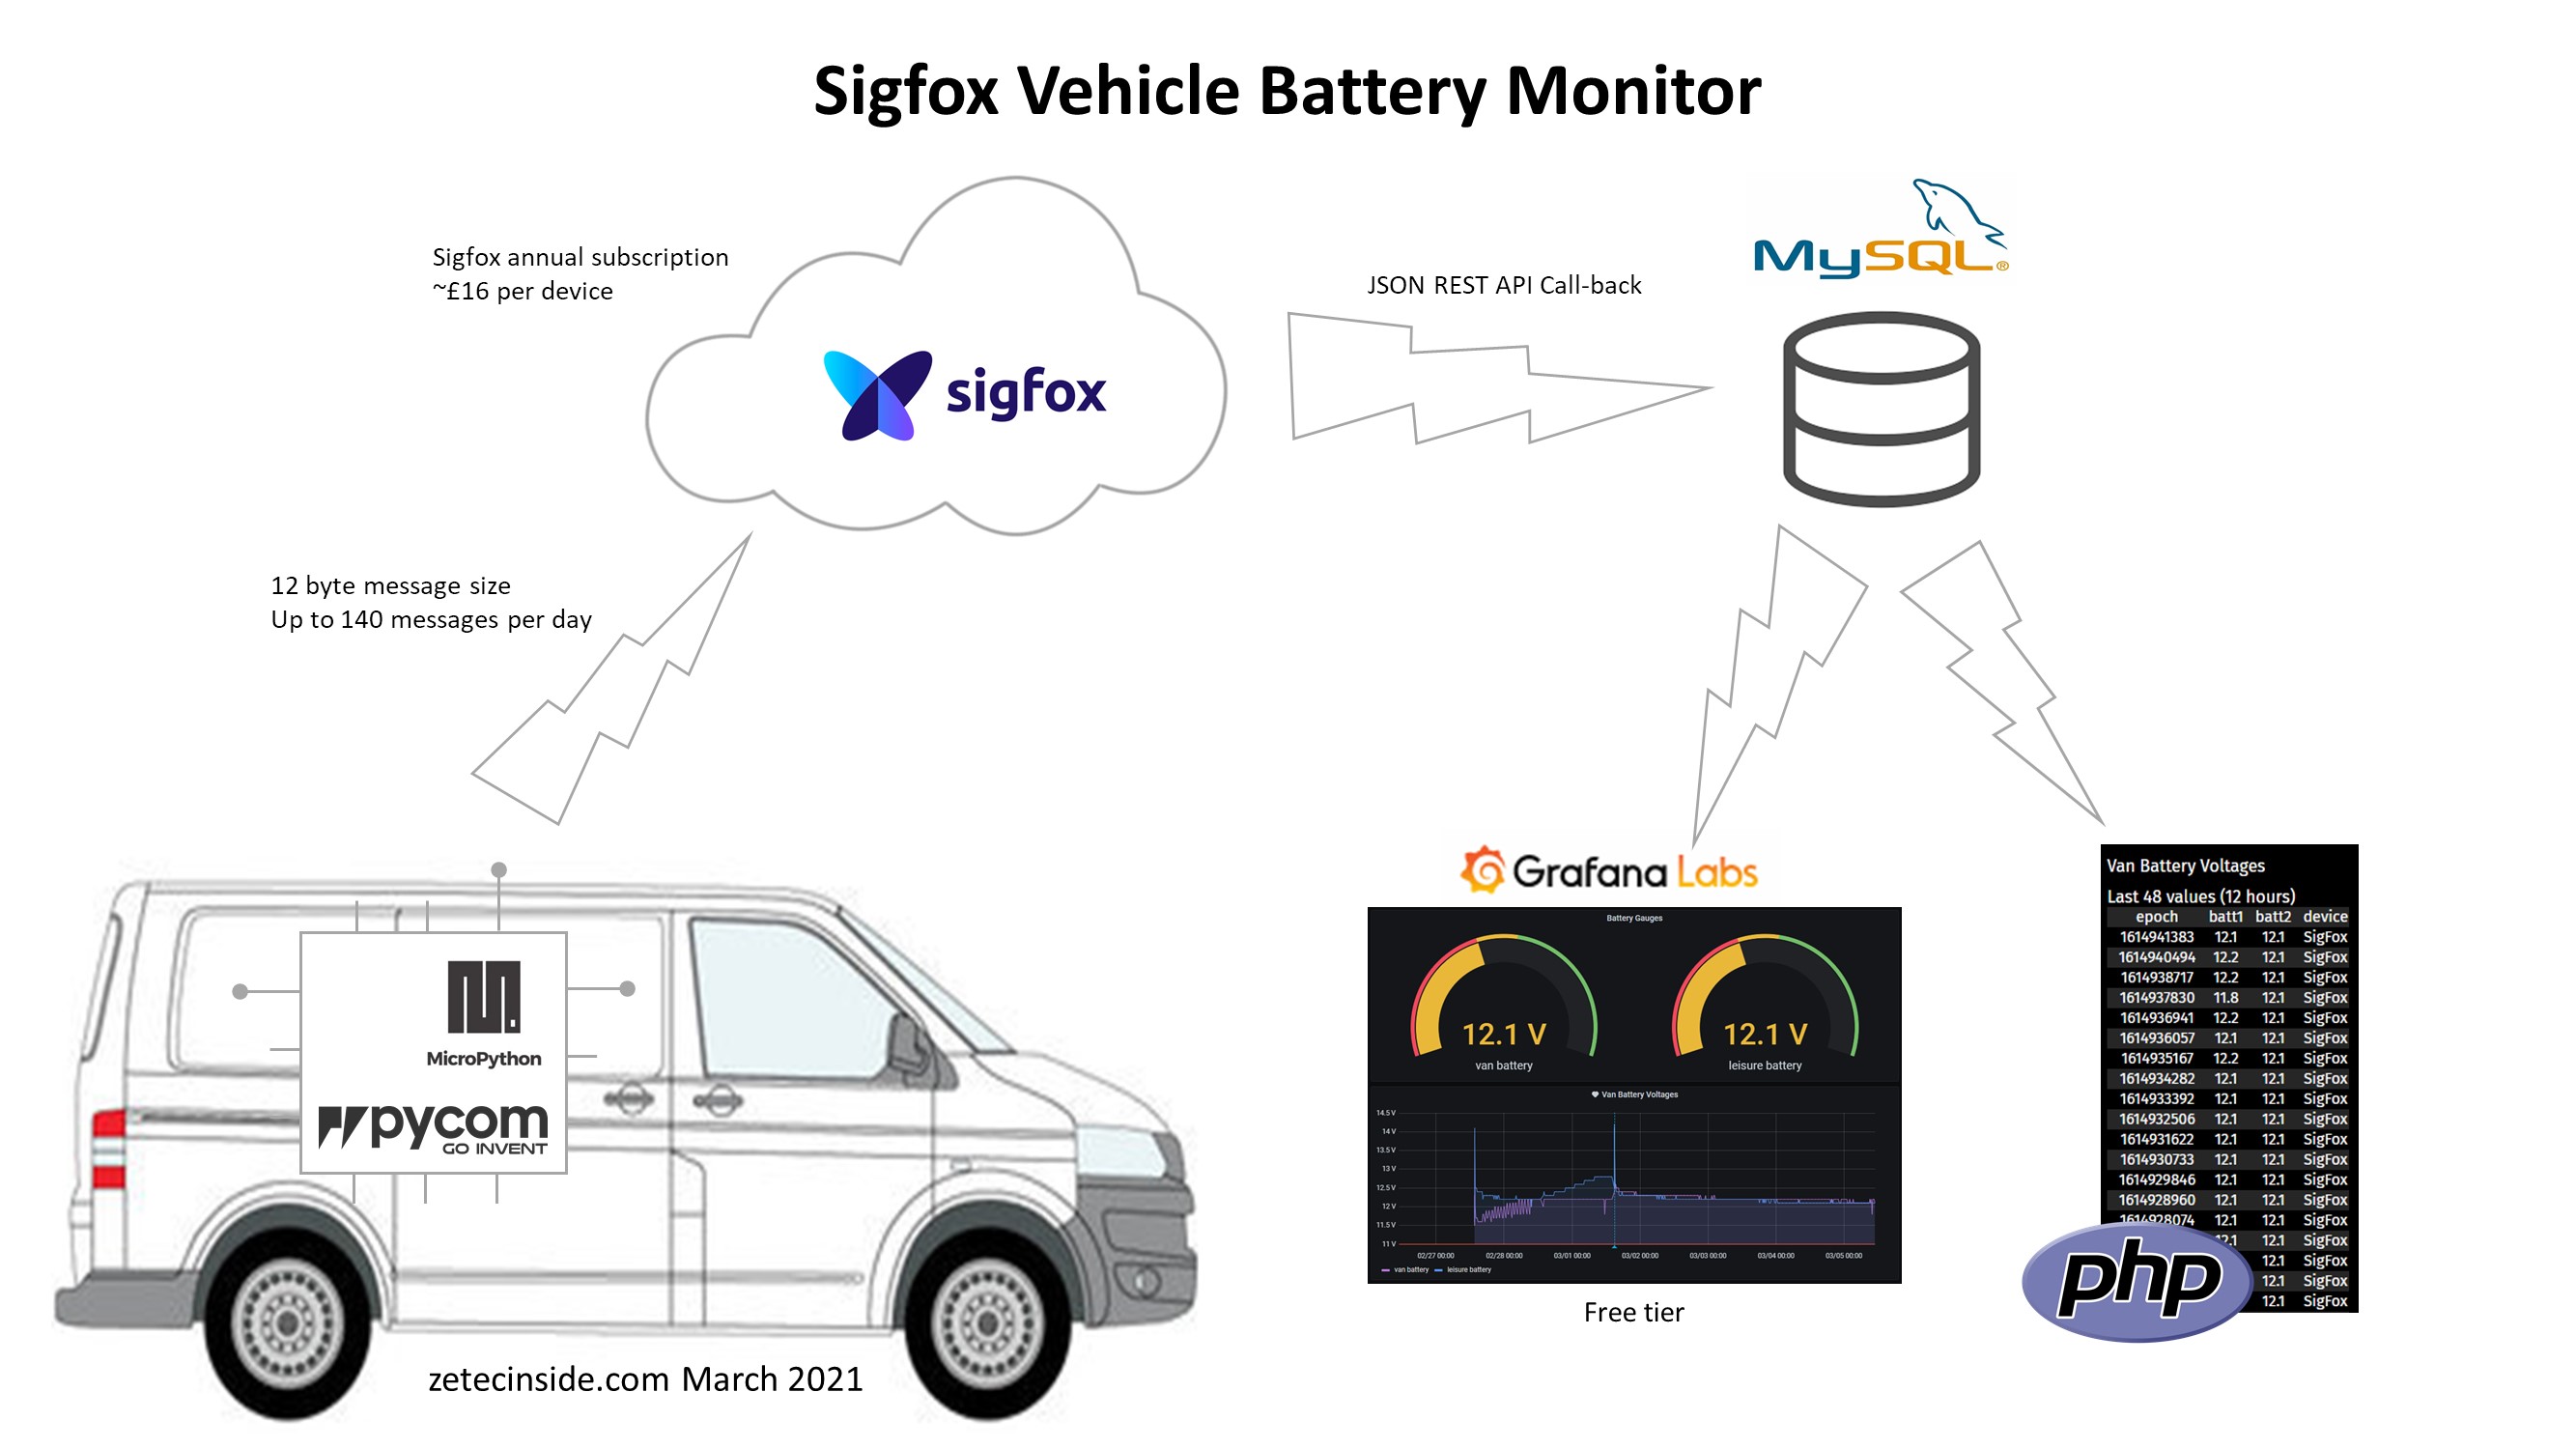
Sigfox battery monitor block diagram
Sigfox 0g (For true remote monitoring)
Now for the van, in storage, there is no WiFi connection for it to send data to the database over the internet. And I wasnt about to use a phone with a hotspot, though you could if you wanted to. I'd read about something called Sigfox, which is a 0G (zero G) data network, using the existing mobile phone network, with extensive coverage across the UK.Pycom sold a SiPy board, so I bought one and started coding again when it arrived a few days later.
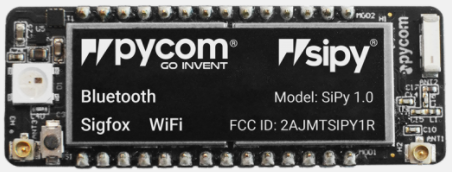
The first job when the board has arrived, is to update the firmware for the SiPy. This process will also display the device ID and PAC numbers, both of which are required when you register the devices on the Sigfox website.
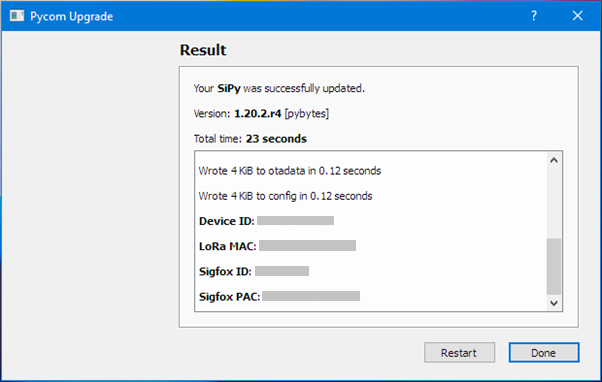
Simply download the firmware updater for Windows, connect the device to your PC using a USB cable, and run the software to perform the update.
I created an account on the Sigfox website, and after updating the firmware on the SiPy, I had the ID and PAC code for the device I'd bought, and the Sigfox website needs these two parameters, in order to enable the SiPy device to work on their 0G network, and to initiate the free 12 months subscription to allow me to develop and install the device.
Sigfox is a low bandwidth IoT platform. Only 140 IoT messages are allowed to be sent a day, and the maximum message size is 12 bytes. This is plenty of data for an IoT device. I was going to send two voltages, as bytes, so each recorded voltage took just one byte, leaving 10 bytes for other channels to be sent if I wanted to.
With the WiPy I was sending the epoch (computer time in seconds since 1970) value over WiFi to the PHP file, but Sigfox provides the epoch time automatically, whenever a message is received. So I changed the message I was sending, to only send two voltages (two bytes), and when the Callback is initiated, the REST API sends the epoch value from the message, to the PHP file. This reduced the number of bytes I was going to send in each message, from 6 (4 epoch, 2 voltage) to just 2.
I wrote the code to initialise the Sigfox sockets from the SiPy, and started sending messages. These appear on the Sigfox backend, and are stored in their messaging system. Nothing else happens, until you create what is called a Callback. This is a function that uses REST API, to allow you to send the received data onwards, to for example, a PHP page on a website. Bingo. I just had to create the REST API code, to take the two bytes received, and send them, together with Epoch time, to my PHP page, which would then take the two bytes, convert them to decimal voltages by dividing by 10, and insert them in to the database.
After a bit more coding, it worked. The SiPy is running a small piece of my code, which every 900 seconds, reads the battery voltages, and sends them over 0G to the Sigfox server, which executes the callback, and sends the data to my PHP file sat on my website.
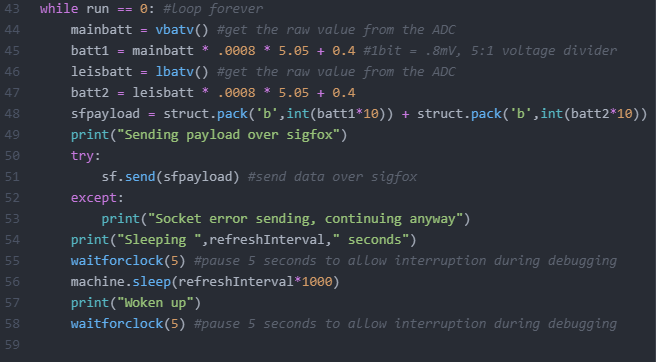
The SiPy Code
This is the micropython code that goes in main.py. It shows the function to initialise the sigfox sockets.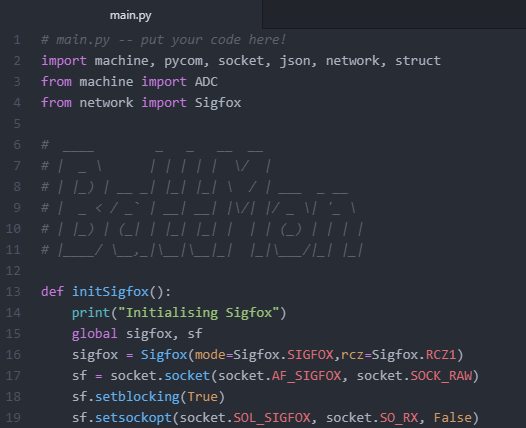
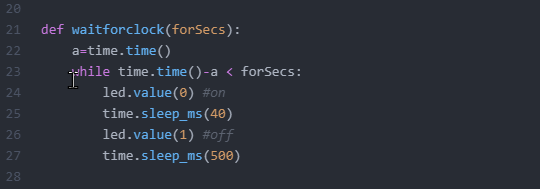
This function pauses the code and flashes the amber user LED whilst the pause is executed. I use it to show that the device is awake and processing, whilst its paused.
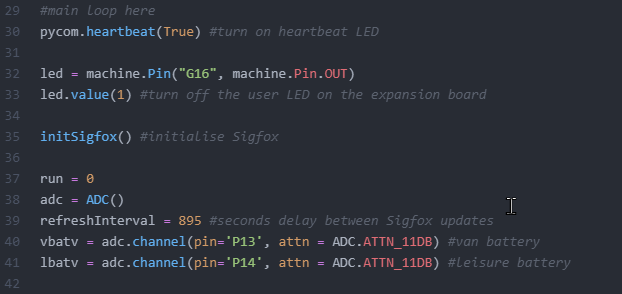
This section turns on the blue heartbeat LED, which flashes once every 4 seconds; it initialises the amber User LED; calls the function to initialise the sigfox sockets; and defines the ADC (Analogue to Digital Convertor) channels, on Pin 13 and Pin 14, to read the pair of battery voltages.
This section is where the processing of the two ADC channels is performed. The values are read, converted to voltages, and packed using the struct.pack function, in to bytes, ready for sending over the sf socket to sigfox. Once the message has been sent to sigfox, the board goes to sleep for 895 seconds, which saves power, and this also means the board sends updates once every 900 or so seconds, ie every 15 minutes.
PHP script
This is part of the PHP code which receives the JSON data from the Sigfox Callback, and inserts the data in to the mySQL table.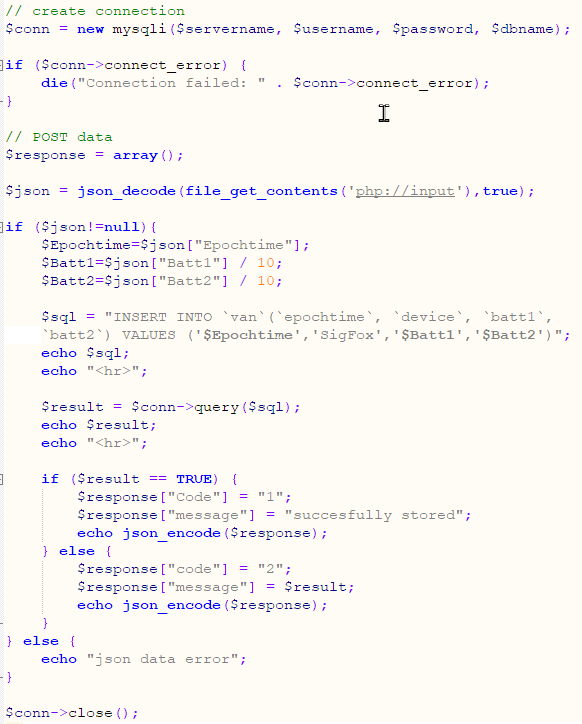
Sigfox Callback to post the message to PHP
This is the Callback I defined to send the received pair of bytes, in JSON format, to the PHP page. This is executed every time a message is sent from the SiPy to Sigfox.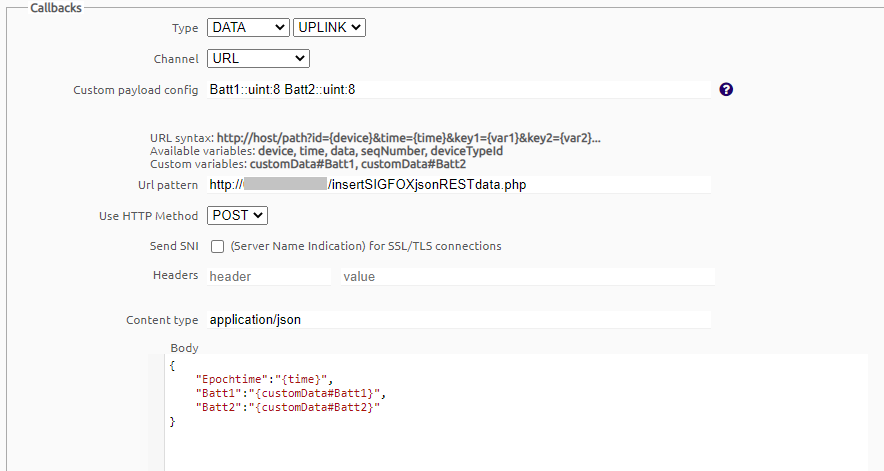
Sigfox Callback result
This is the result from the Sigfox Callback function, showing that the data has been succesfully received by the PHP file, insertSIGFOXjsonRESTdata.php.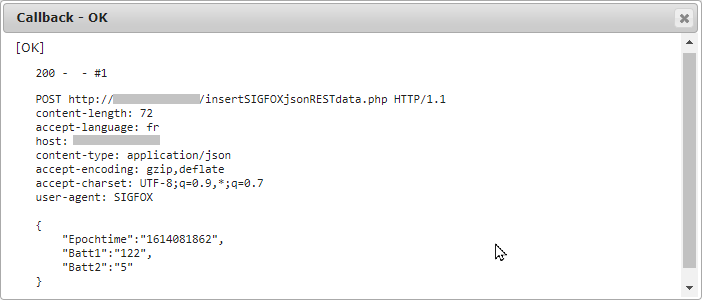
Latest data